
- Weekly global scheduled capacity is 32.2% compared to a year ago.
- The world’s busiest airport last week was Guangzhou in China
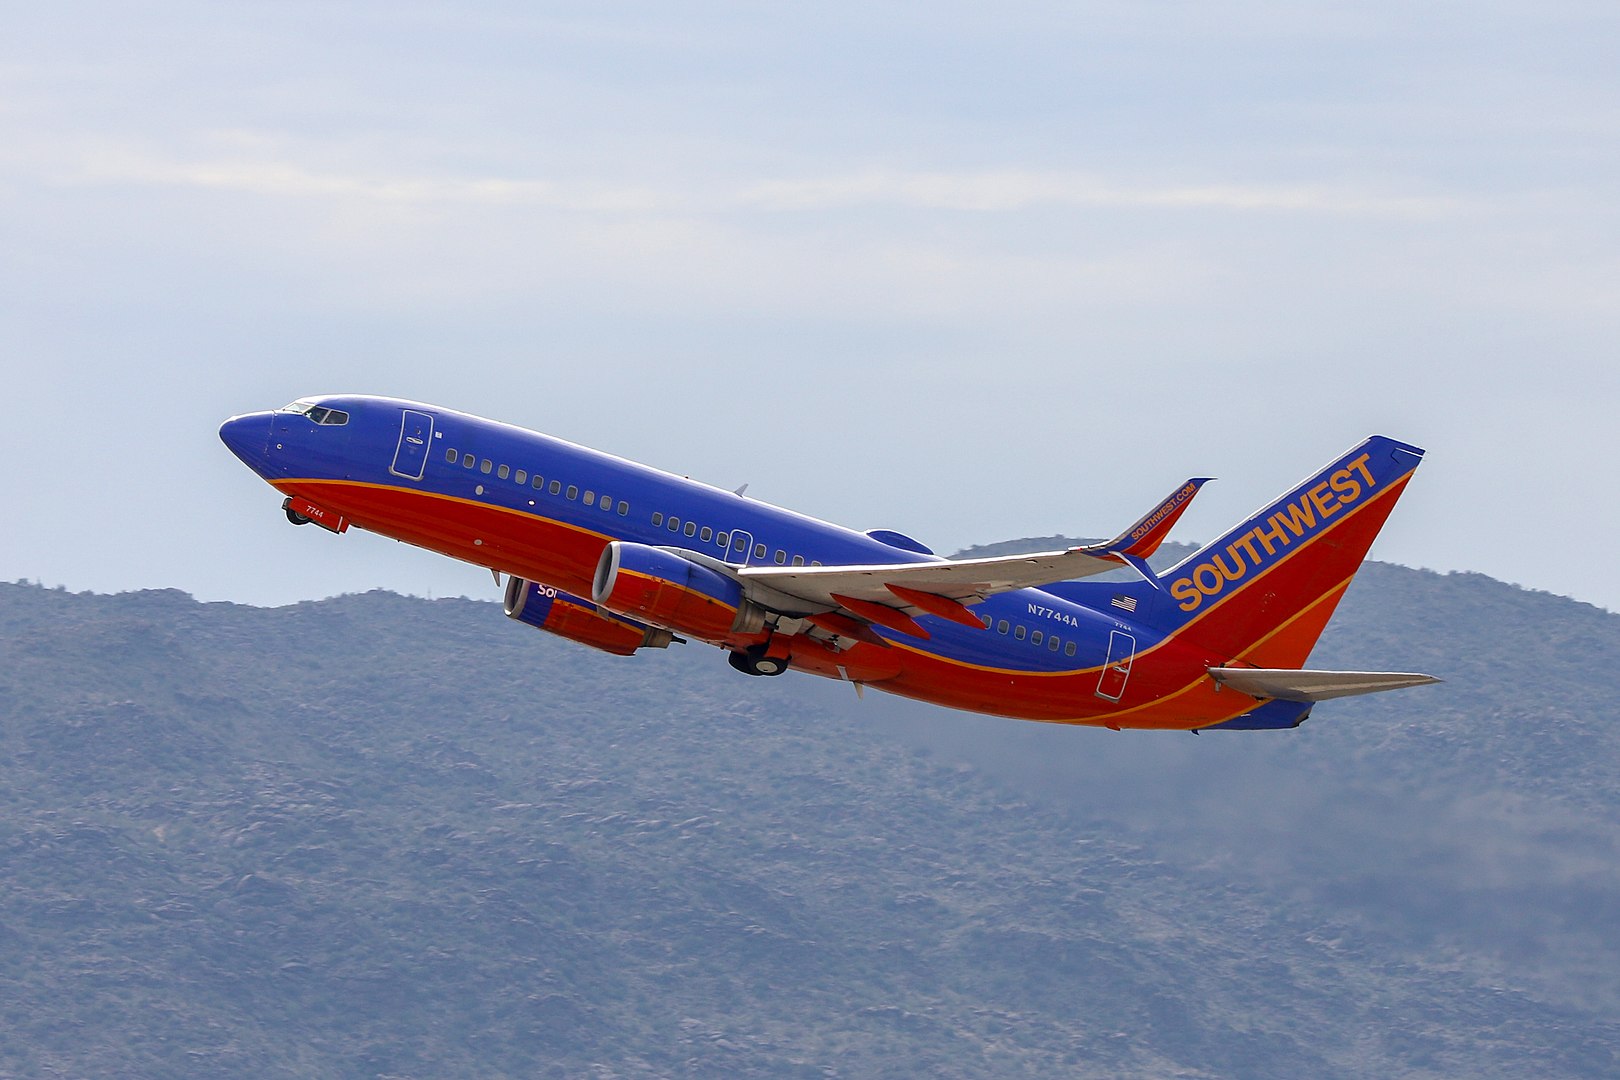
- By weekly capacity, Southwest Airlines was the biggest carrier
Beijing is suffering a second wave of coronavirus infections. Chinese authorities have drastically reduced travel outside of the city including a two-thirds reduction in departures from Capital and Daxing airports. In light of this—possibly a second shock to the Asian market—we take a look at the revival thus far of the global commercial aviation market.
- Global Departures
- The week of 27th January 2020 was the point in time immediately before carriers began to reduce capacity as a result of the pandemic. Capacity at that point was higher–at 102%–compared to the same point in 2019: 107 million weekly departure seats. (MDS)
- The week of 4th May 2020 was the lowest point. Capacity at that point was 28% compared to 2019: 30.6 MWD.
- The latest data for 8th June 2020, indicates the capacity is at 37.3 MDS, 32% compared to 2019, an increase of 4 percentage points in 5 weeks.
- Regional Departures
| Region | Start of Reduction | MDS | Bottom of Reduction | MDS | MDS 8 June |
| Asia-Pacific | 27 January | 44.5 | 20 April | 16.9 | 21.6 |
| Europe | 2 March | 23.8 | 20 April | 2.6 | 4.9 |
| North America | 16 March | 24.5 | 11 May | 5.3 | 7.3 |
| Latin America | 16 March | 8.9 | 18 May | 1.0 | 1.4 |
| Middle East | 2 March | 4.9 | 11 May | 1.0 | 1.5 |
| Africa | 9 March | 3.2 | 18 May | 0.6 | 0.6 |
- The weekly departures in the African region increased by ~50 000 between 18 May and 8 June.
- From 2nd March to 16th March, weekly departures in North America increased by 3%, whereas in Europe they decreased by 7%
- From 17th February to 2nd March capacity in Asia-Pacific increased by 11% then fell again.
- Week-on-Week Capacity Growth by Country
Guangzhou Airport © Flickr Commons
Between the 1st and 8th June, the USA added the most seats; 930 000, a 15% increase. Turkey added the most capacity by percentage, 31% (165 962 seats). China has the most seats available, at 12.4 million.
- Busiest Airports
A year ago, the top 10 busiest airports offered a total of 10.5 MDS. Last week the same airports offered 2.67 MDS. Last week the busiest airport in the world was Guangzhou, (CAN) followed by Beijing Capital (PEK) and Tokyo-Haneda (HND)
Data derived from OAG Schedules Analyser. Any interpretation from that data is tentative and subject to the fluid nature of the coronavirus transmission pattern.